- Sep 20, 2023
Analyze The Titanic Disaster With C# And MLNET
The sinking of the RMS Titanic is one of the most infamous shipwrecks in history. On April 15, 1912, during her maiden voyage, the Titanic sank after colliding with an iceberg, killing 1502 out of 2224 passengers and crew. This sensational tragedy shocked the international community and led to better safety regulations for ships.

One of the reasons that the shipwreck led to such loss of life was that there were not enough lifeboats for the passengers and crew. Although there was some element of luck involved in surviving the sinking, some groups of people were more likely to survive than others, such as women, children, and the upper-class.
In this article, I’ll show you how to analyze what sorts of people were likely to survive. I’m going to build a C# machine learning app with MLNET and NET Core to predict which passengers survived the tragedy.
MLNET is Microsoft’s new machine learning library. It can run linear regression, logistic classification, clustering, deep learning, and many other machine learning algorithms.
And NET Core is the Microsoft multi-platform NET Framework that runs on Windows, OS/X, and Linux. It’s the future of cross-platform NET development.
The first thing I need for my app is a data file with the Titanic passenger manifest and a label indicating which passengers survived the disaster. I will use the famous Kaggle Titanic Dataset which has data for 893 passengers.
The training data file looks like this:
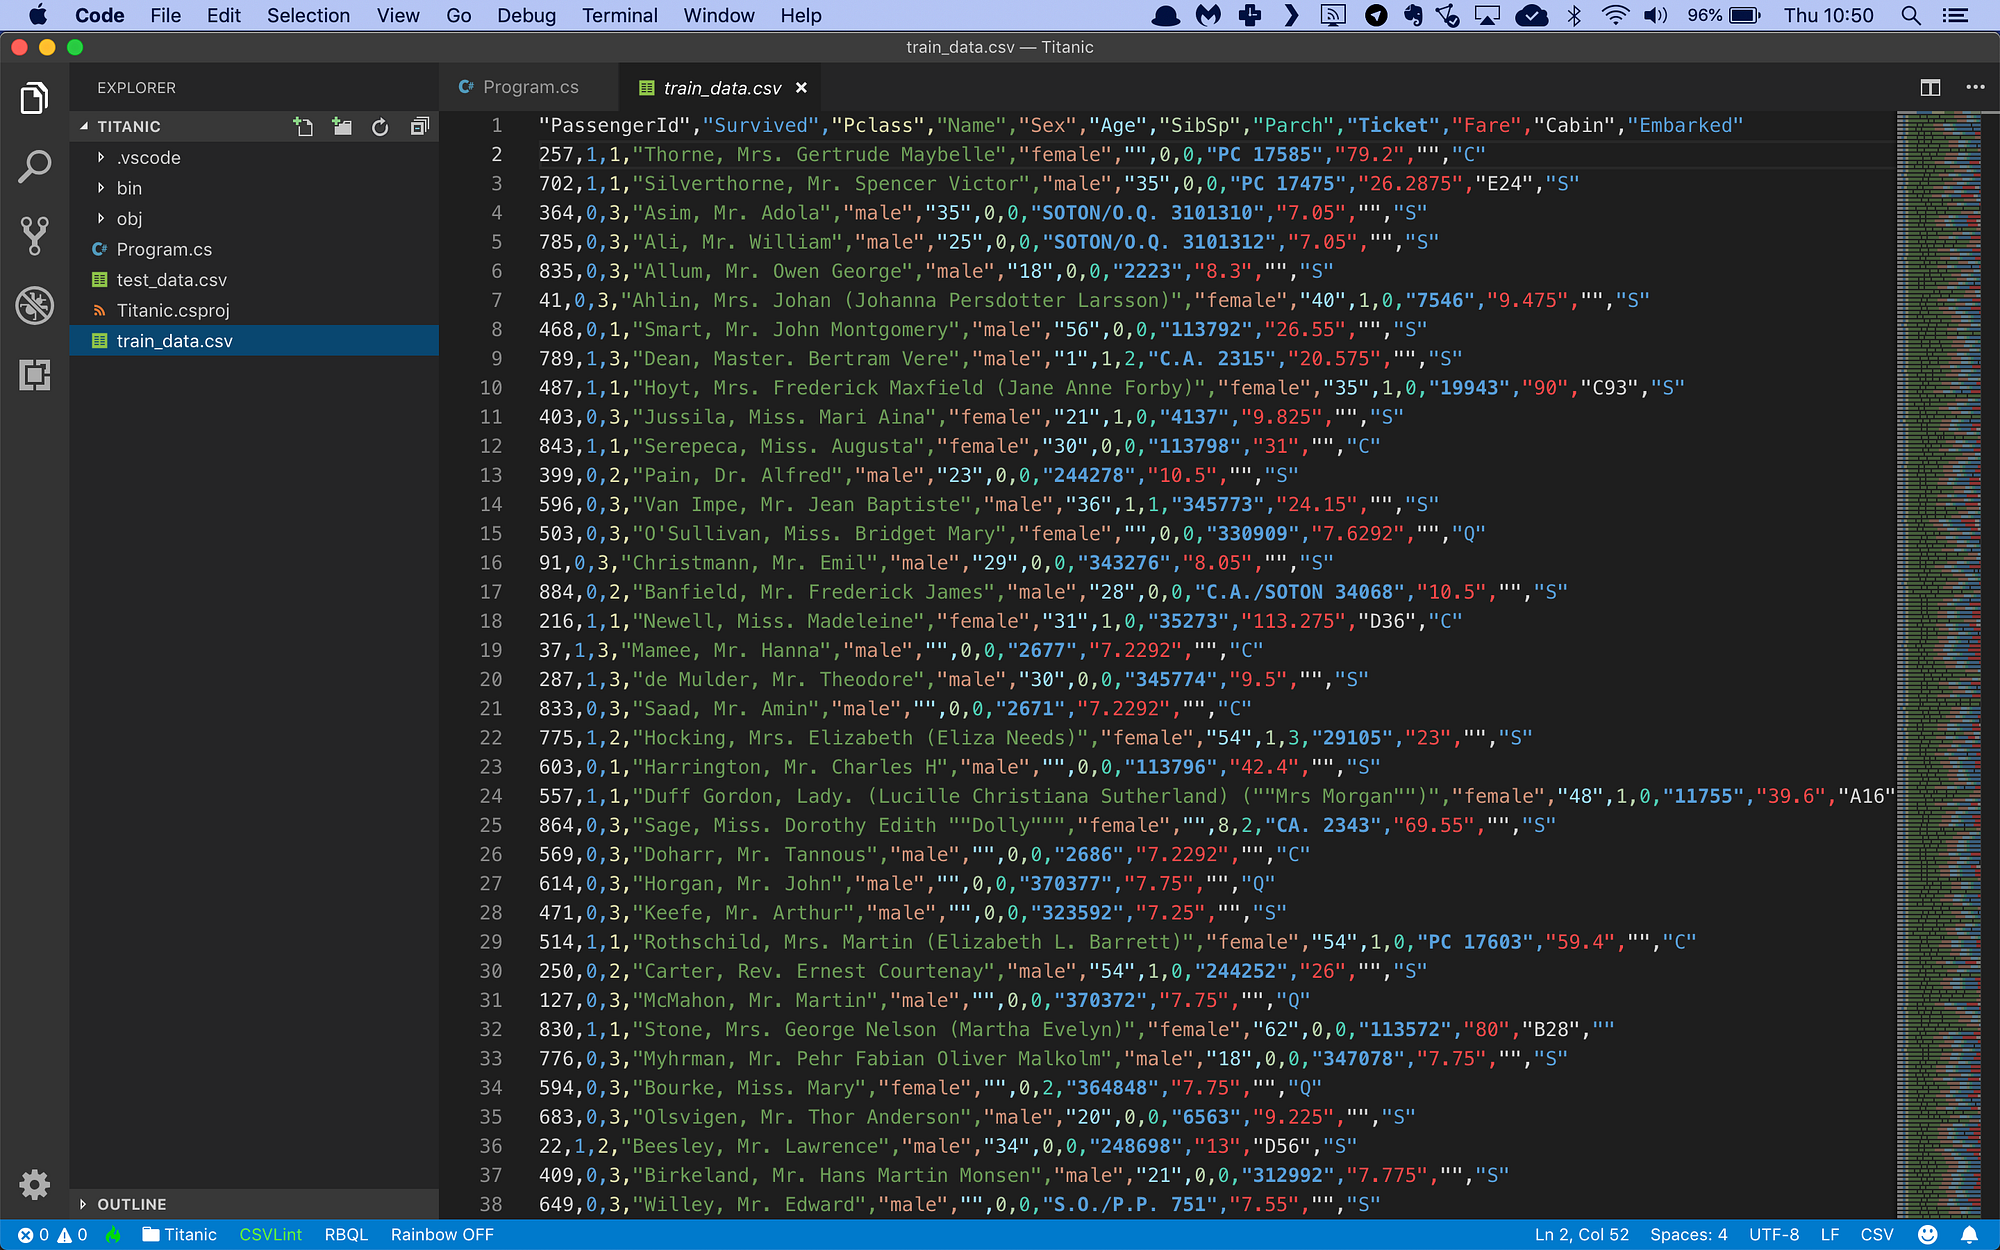
It’s a CSV file with 12 columns of information:
The passenger identifier
The label column containing ‘1’ if the passenger survived and ‘0’ if the passenger perished
The class of travel (1–3)
The name of the passenger
The gender of the passenger (‘male’ or ‘female’)
The age of the passenger, or ‘0’ if the age is unknown
The number of siblings and/or spouses aboard
The number of parents and/or children aboard
The ticket number
The fare paid
The cabin number
The port in which the passenger embarked
The second column is the label: 0 means the passenger perished, and 1 means the passenger survived. All other columns are input data from the passenger manifest.
I will build a binary classification machine learning model that reads in all columns, and then makes a prediction for each passenger if he or she survived.
Let’s get started. Here’s how to set up a new console project in NET Core:
$ dotnet new console -o Titanic
$ cd Titanic
Next, I need to install NuGet packages:
$ dotnet add package Microsoft.ML
$ dotnet add package BetterConsoleTables
Microsoft.ML is the main MLNET library, and BetterConsoleTables is a library that lets me output nice-looking tables to the console.
Now I’m ready to start coding. I will start by loading the training data in memory.
I will modify the Program.cs file like this:
/// <summary>
/// The main program class.
/// </summary>
public class Program
{
    // filenames for training and test data
    private static string trainingDataPath = Path.Combine(Environment.CurrentDirectory, "train_data.csv");
    private static string testDataPath = Path.Combine(Environment.CurrentDirectory, "test_data.csv");

    /// <summary>
    /// The main application entry point.
    /// </summary>
    /// <param name="args">The command line arguments.</param>
    public static void Main(string[] args)
    {
        // set up a machine learning context
        var mlContext = new MLContext();

        // set up a text loader
        var textLoader = mlContext.Data.CreateTextLoader(
            new TextLoader.Options()
            {
                Separators = new[] { ',' },
                HasHeader = true,
                AllowQuoting = true,
                Columns = new[]
                {
                    new TextLoader.Column("Label", DataKind.Boolean, 1),
                    new TextLoader.Column("Pclass", DataKind.Single, 2),
                    new TextLoader.Column("Name", DataKind.String, 3),
                    new TextLoader.Column("Sex", DataKind.String, 4),
                    new TextLoader.Column("RawAge", DataKind.String, 5),  // <-- not a float!
                    new TextLoader.Column("SibSp", DataKind.Single, 6),
                    new TextLoader.Column("Parch", DataKind.Single, 7),
                    new TextLoader.Column("Ticket", DataKind.String, 8),
                    new TextLoader.Column("Fare", DataKind.Single, 9),
                    new TextLoader.Column("Cabin", DataKind.String, 10),
                    new TextLoader.Column("Embarked", DataKind.String, 11)
                }
            }
        );

        // load training and test data
        Console.WriteLine("Loading data...");
        var trainingDataView = textLoader.Load(trainingDataPath);
        var testDataView = textLoader.Load(testDataPath);

        // the rest of the code goes here...
    }
}
This code uses the CreateTextLoader method to create a CSV data loader. The TextLoader.Options class describes how to load each field. Then I call the text loader’s Load method twice to load the train- and test data in memory.
Note how I’m loading the age column as a string and not a number. I’m doing this because ML.NET expects missing data in CSV files to appear as a ‘?’. Unfortunately my Titanic file uses a ‘0’ to indicate an unknown age.
So the first thing I need to do is replace all ‘0’ age occurrences with ‘?’.
I’ll need to declare two helper classes for this:
/// <summary>
/// The RawAge class is a helper class for a column transformation.
/// </summary>
public class FromAge
{
    public string RawAge;
}

/// <summary>
/// The ProcessedAge class is a helper class for a column transformation.
/// </summary>
public class ToAge
{
    public string Age;
}
I’ll use the FromAge and ToAge classes in the next step to transform the data.
Machine learning models in ML.NET are built with pipelines, which are sequences of data-loading, transformation, and learning components.
I’m not interested in the Name, Cabin, and Ticket columns. The data in those columns will not help the machine learning model to predict if the passenger survived or perished. So I’ll drop them from my dataset with the DropColumns component.
Then I’ll add a CustomMapping component which will convert my unknown age values to ‘?’ strings:
// set up a training pipeline
// step 1: drop the name, cabin, and ticket columns
var pipeline = mlContext.Transforms.DropColumns("Name", "Cabin", "Ticket")

    // step 2: replace missing ages with '?'
    .Append(mlContext.Transforms.CustomMapping<FromAge, ToAge>(
        (inp, outp) => { outp.Age = string.IsNullOrEmpty(inp.RawAge) ? "?" : inp.RawAge; },
        "AgeMapping"
    ))

    // the rest of the code goes here...
Now MLNET is happy with the age values. I’ll convert the string ages to numeric values and instruct MLNET to replace missing values with the mean age over the entire dataset:
// step 3: convert string ages to floats
.Append(mlContext.Transforms.Conversion.ConvertType(
    "Age",
    outputKind: DataKind.Single
))

// step 4: replace missing age values with the mean age
.Append(mlContext.Transforms.ReplaceMissingValues(
    "Age",
    replacementKind: MissingValueReplacingEstimator.ColumnOptions.ReplacementMode.Mean))

// the rest of the code goes here...
The Sex and Embarked columns are enumerations of string values. My machine learning model can deal with that, but I need to one-hot encode them first:
// step 5: replace sex and embarked columns with one-hot encoded vectors
.Append(mlContext.Transforms.Categorical.OneHotEncoding("Sex"))
.Append(mlContext.Transforms.Categorical.OneHotEncoding("Embarked"))

// the rest of the code goes here...
And finally, I’ll concatenate all remaining columns into a single feature column (a requirement for MLNET training) and attach a Fast Tree Learner to train the model:
// step 6: concatenate everything into a single feature column
.Append(mlContext.Transforms.Concatenate(
    "Features",
    "Age",
    "Pclass",
    "SibSp",
    "Parch",
    "Sex",
    "Embarked"))

// step 7: use a fasttree trainer
.Append(mlContext.BinaryClassification.Trainers.FastTree(
    labelColumnName: DefaultColumnNames.Label,
    featureColumnName: DefaultColumnNames.Features));

// the rest of the code goes here...
The FastTreeBinaryClassificationTrainer is a very nice training algorithm that uses gradient boosting, a machine learning technique for classification problems.
Now let’s take a look inside the MLNET training pipeline. What are the final data columns? What does the actual data look like?
I’m going to add a helper method to the Program class that can write the contents of the pipeline to the console. Check this out:
/// <summary>
/// Helper method to write the machine learning pipeline to the console.
/// </summary>
/// <param name="mlContext">The machine learning context.</param>
/// <param name="dataView">The data view object holding the data.</param>
/// <param name="pipeline">The machine learning pipeline.</param>
/// <param name="numberOfRows">The maximum number of rows to write.</param>
public static void WritePipeline(MLContext mlContext, IDataView dataView, IEstimator<ITransformer> pipeline, int numberOfRows = 4)
{
    // helper method to write a value to the console table
    object WriteValue(object value)
    {
            if (value is VBuffer<float>)
            return "<vector>";
        else
            return value;
    }

    // get a preview of the transformed data
    var transformer = pipeline.Fit(dataView);
    var transformedData = transformer.Transform(dataView);
    var preview = transformedData.Preview(maxRows: numberOfRows);

    // set up a console table
    var table = new Table(
        TableConfiguration.Unicode(),
        (from c in preview.ColumnView select c.Column.Name).ToArray());

    // fill the table with results
    foreach (var row in preview.RowView)
        table.AddRow((from c in row.Values select WriteValue(c.Value)).ToArray());

    // write the table
    Console.WriteLine(table.ToString());
}
This code uses the BetterConsoleTables library to write the pipeline to the console in a nice format. And there’s some extra code to display sparse- and dense vectors in a compact format so they don’t mess up the layout of the table.
With this method in place, add the following line to your Main method:
// show the first 10 data records in the pipeline
WritePipeline(mlContext, trainingDataView, pipeline, 10);

// the rest of the code goes here...
Run the code. Here’s what you’ll see:
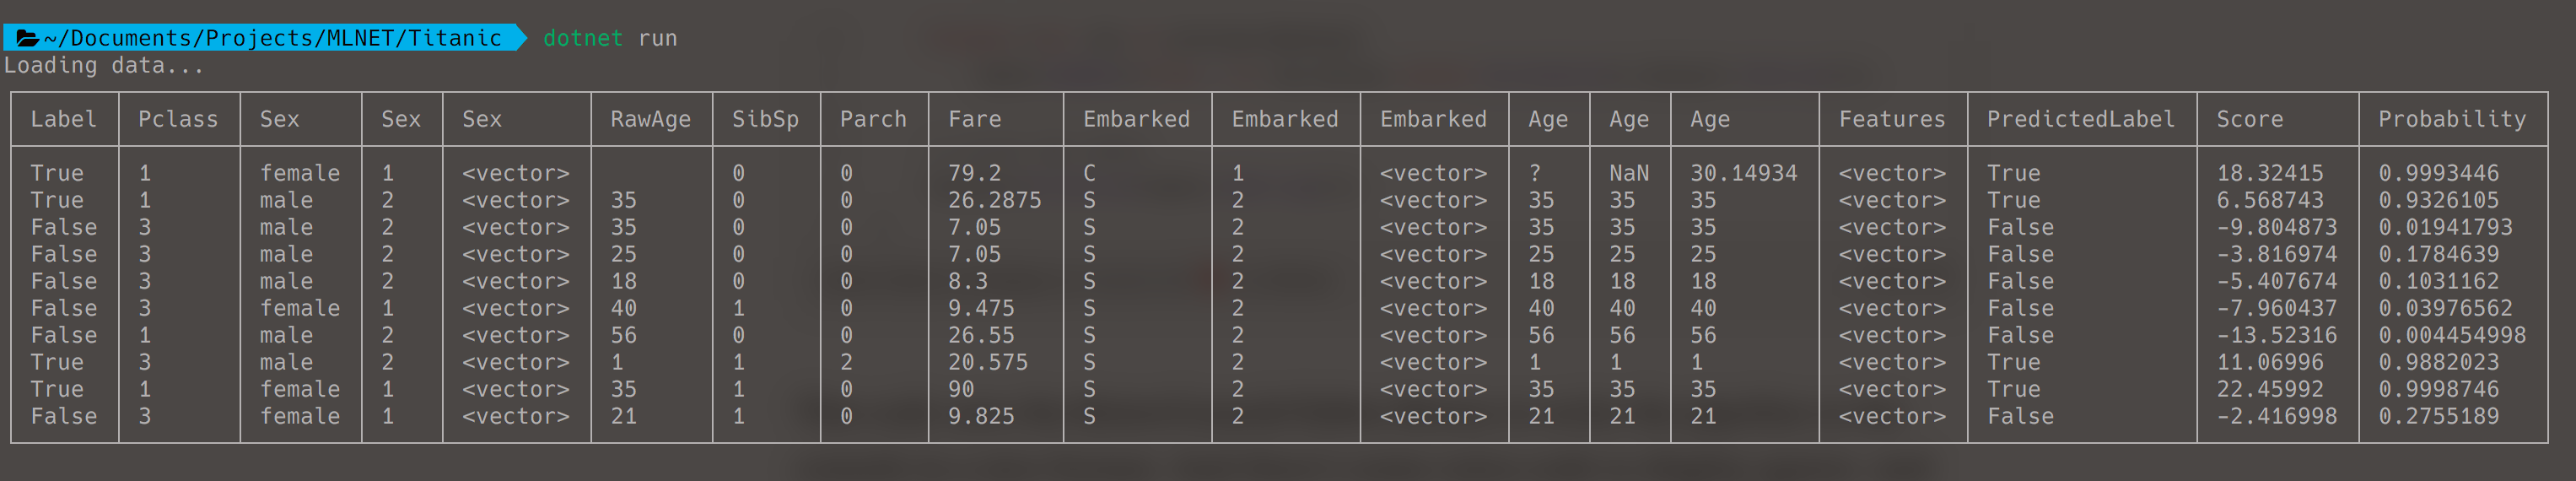
Note that there are four Age columns: the original RawAge column, the new Age column with ‘?’ values, the Age column with numbers (and NaN for missing values), and the final Age column with missing values replaced with the mean age.
There are also three Sex columns: one with the original data, one with numbers representing each unique gender value, and one with the one-hot encoded vectors.
And the same goes for the Embarked column.
The last three columns are added by the FastTree learner. The model prediction is in the PredictedLabel column, and there’s also a Score and the Probability that the passenger survived.
So all I need to do now is train the model on the entire dataset, compare the predictions with the labels, and compute a bunch of metrics that describe how accurate my model is:
// train the model
Console.WriteLine("Training model...");
var trainedModel = pipeline.Fit(trainingDataView);

// make predictions for the test data set
Console.WriteLine("Evaluating model...");
var predictions = trainedModel.Transform(testDataView);

// compare the predictions with the ground truth
var metrics = mlContext.BinaryClassification.Evaluate(
    data: predictions,
    label: DefaultColumnNames.Label,
    score: DefaultColumnNames.Score);

// report the results
Console.WriteLine($"  Accuracy:          {metrics.Accuracy:P2}");
Console.WriteLine($"  Auc:               {metrics.Auc:P2}");
Console.WriteLine($"  Auprc:             {metrics.Auprc:P2}");
Console.WriteLine($"  F1Score:           {metrics.F1Score:P2}");
Console.WriteLine($"  LogLoss:           {metrics.LogLoss:0.##}");
Console.WriteLine($"  LogLossReduction:  {metrics.LogLossReduction:0.##}");
Console.WriteLine($"  PositivePrecision: {metrics.PositivePrecision:0.##}");
Console.WriteLine($"  PositiveRecall:    {metrics.PositiveRecall:0.##}");
Console.WriteLine($"  NegativePrecision: {metrics.NegativePrecision:0.##}");
Console.WriteLine($"  NegativeRecall:    {metrics.NegativeRecall:0.##}");
Console.WriteLine();

// the rest of the code goes here...
This code calls Fit to train the model on the entire dataset, Transform to set up a prediction for each passenger, and Evaluate to compare these predictions to the label and automatically calculate all evaluation metrics:
Accuracy: this is the number of correct predictions divided by the total number of predictions.
AUC: a metric that indicates how accurate the model is: 0 = the model is wrong all the time, 0.5 = the model produces random output, 1 = the model is correct all the time. An AUC of 0.8 or higher is considered good.
AUCPRC: an alternate AUC metric that performs better for heavily imbalanced datasets with many more negative results than positive.
F1Score: this is a metric that strikes a balance between Precision and Recall. It’s useful for imbalanced datasets with many more negative results than positive.
LogLoss: this is a metric that expresses the size of the error in the predictions the model is making. A logloss of zero means every prediction is correct, and the loss value rises as the model makes more and more mistakes.
LogLossReduction: this metric is also called the Reduction in Information Gain (RIG). It expresses the probability that the model’s predictions are better than random chance.
PositivePrecision: also called ‘Precision’, this is the fraction of positive predictions that are correct. This is a good metric to use when the cost of a false positive prediction is high.
PositiveRecall: also called ‘Recall’, this is the fraction of positive predictions out of all positive cases. This is a good metric to use when the cost of a false negative is high.
NegativePrecision: this is the fraction of negative predictions that are correct.
NegativeRecall: this is the fraction of negative predictions out of all negative cases.
I’m looking at a historic disaster, which means the cost of false positives and false negatives is about equal. So I can safely use the Accuracy metric to evaluate my model.
The data set also has a somewhat balanced distribution of positive and negative labels, so there’s no need to use the AUCPRC or F1Score metrics.
So I will focus on Accuracy and AUC to evaluate this model.
To wrap up, I’m going to create a new passenger and ask the model to make a prediction.
I’m going to take a trip on the Titanic. I embarked in Southampton and paid $70 for a first-class cabin. I travelled on my own without parents, children, or my spouse. What are my odds of surviving?
Before I can make a prediction, I need to set up two classes: one to hold a passenger record, and one to hold a passenger prediction:
/// <summary>
/// The Passenger class represents one passenger on the Titanic.
/// </summary>
public class Passenger
{
    public bool Label;
    public float Pclass;
    public string Name;
    public string Sex;
    public string RawAge;
    public float SibSp;
    public float Parch;
    public string Ticket;
    public float Fare;
    public string Cabin;
    public string Embarked;
}

/// <summary>
/// The PassengerPrediction class represents one model prediction.
/// </summary>
public class PassengerPrediction
{
    [ColumnName("PredictedLabel")] public bool Prediction;
    public float Probability;
    public float Score;
}
Next, I’ll set up my data in a new passenger record, make the prediction, and output the results:
// set up a prediction engine
Console.WriteLine("Making a prediction...");
var predictionEngine = trainedModel.CreatePredictionEngine<Passenger, PassengerPrediction>(mlContext);

// create a sample record
var passenger = new Passenger()
{
    Pclass = 1,
    Name = "Mark Farragher",
    Sex = "male",
    RawAge = "48",
    SibSp = 0,
    Parch = 0,
    Fare = 70,
    Embarked = "S"
};

// make the prediction
var prediction = predictionEngine.Predict(passenger);

// report the results
Console.WriteLine($"Passenger:   {passenger.Name} ");
Console.WriteLine($"Prediction:  {(prediction.Prediction ? "survived" : "perished" )} ");
Console.WriteLine($"Probability: {prediction.Probability} ");
I use the CreatePredictionEngine method to set up a prediction engine. The two type arguments are the input data class and the class to hold the prediction. And once my prediction engine is set up, I can simply call Predict(…) to make a single prediction.
So how did I do? Would I have survived the Titanic disaster?
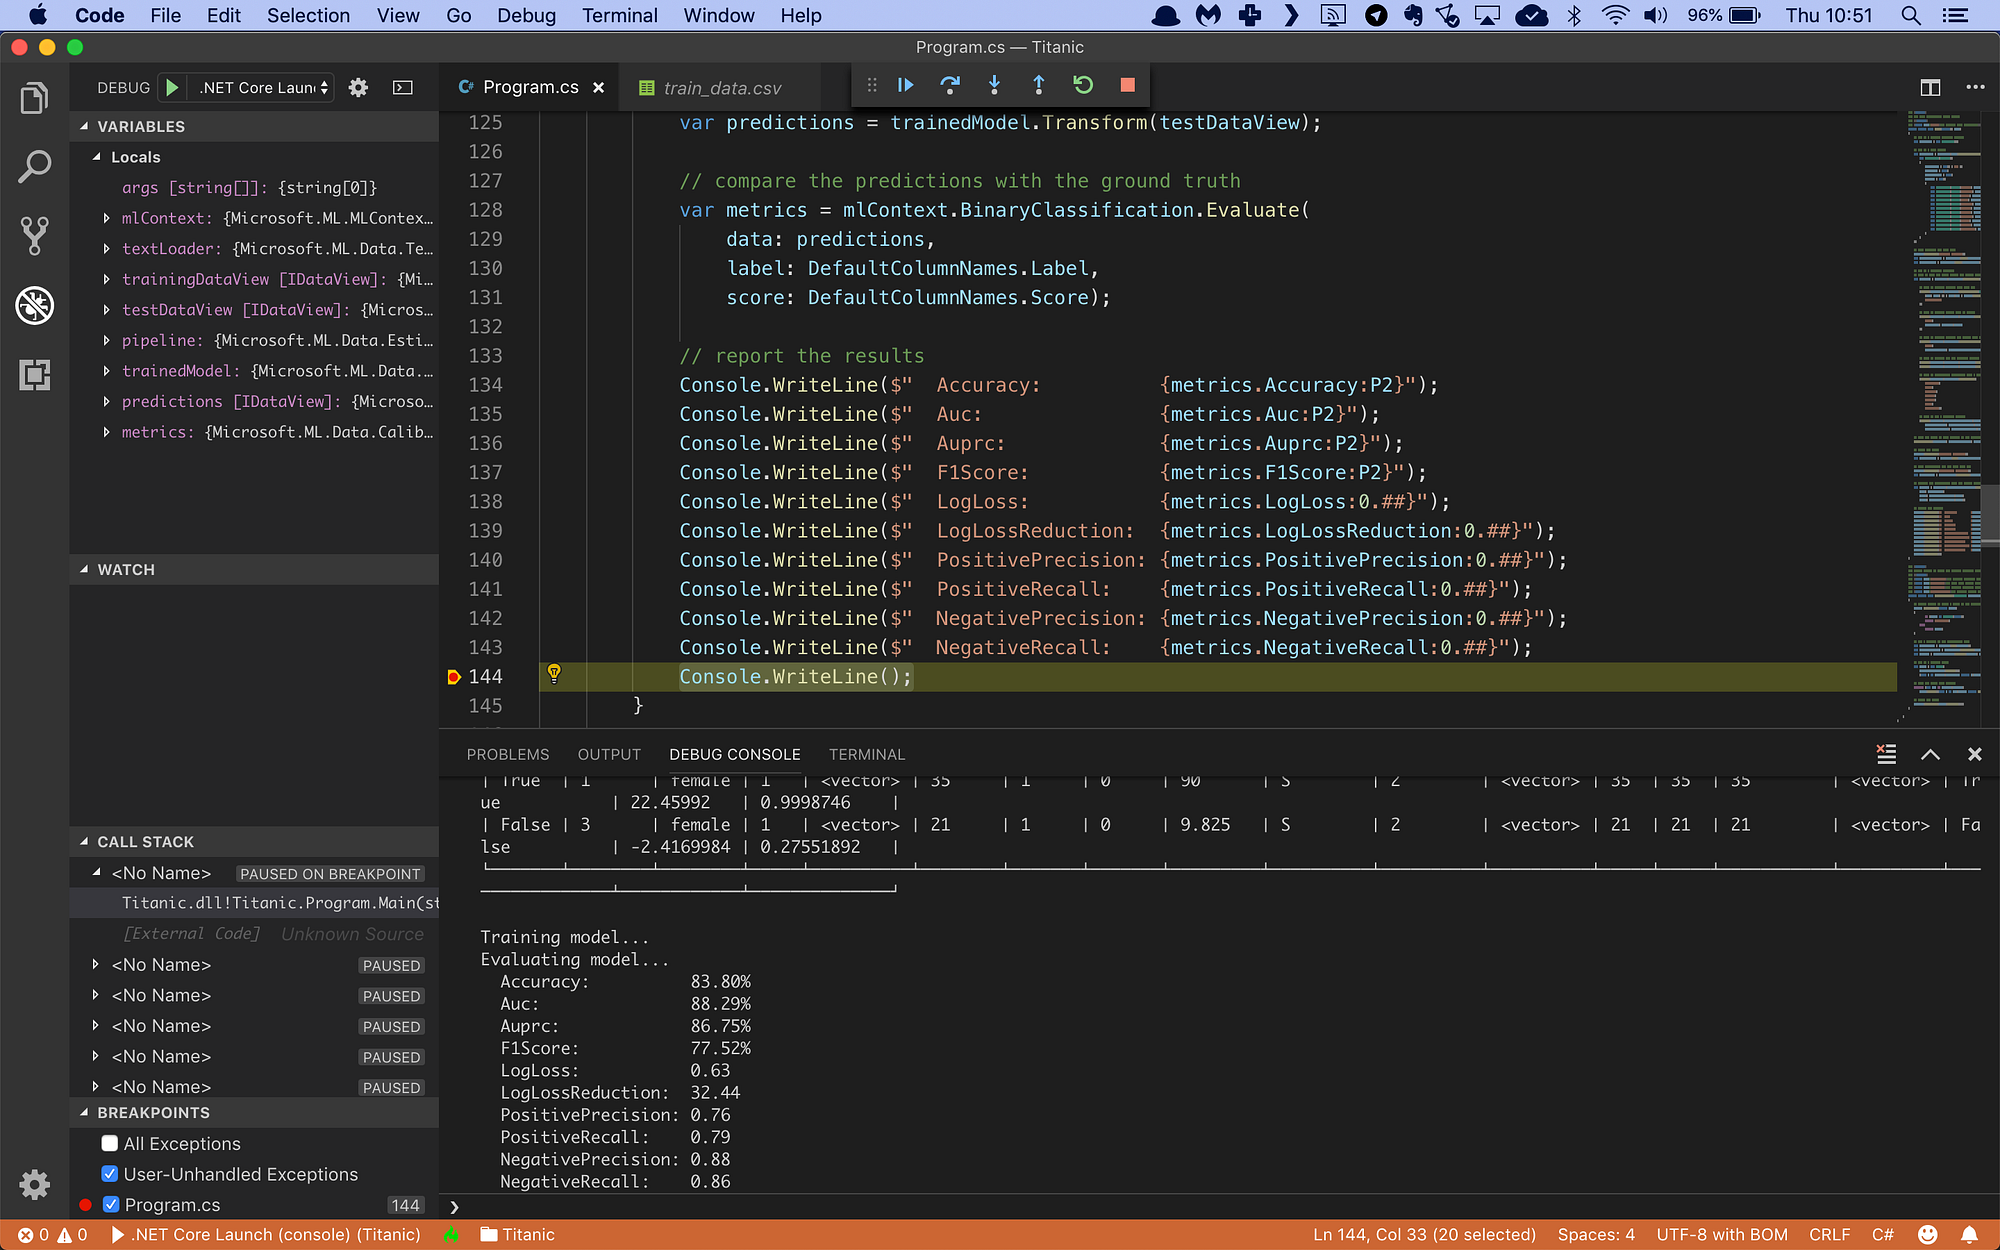
Here’s the code running in the Visual Studio Code debugger:
… and in a terminal window:
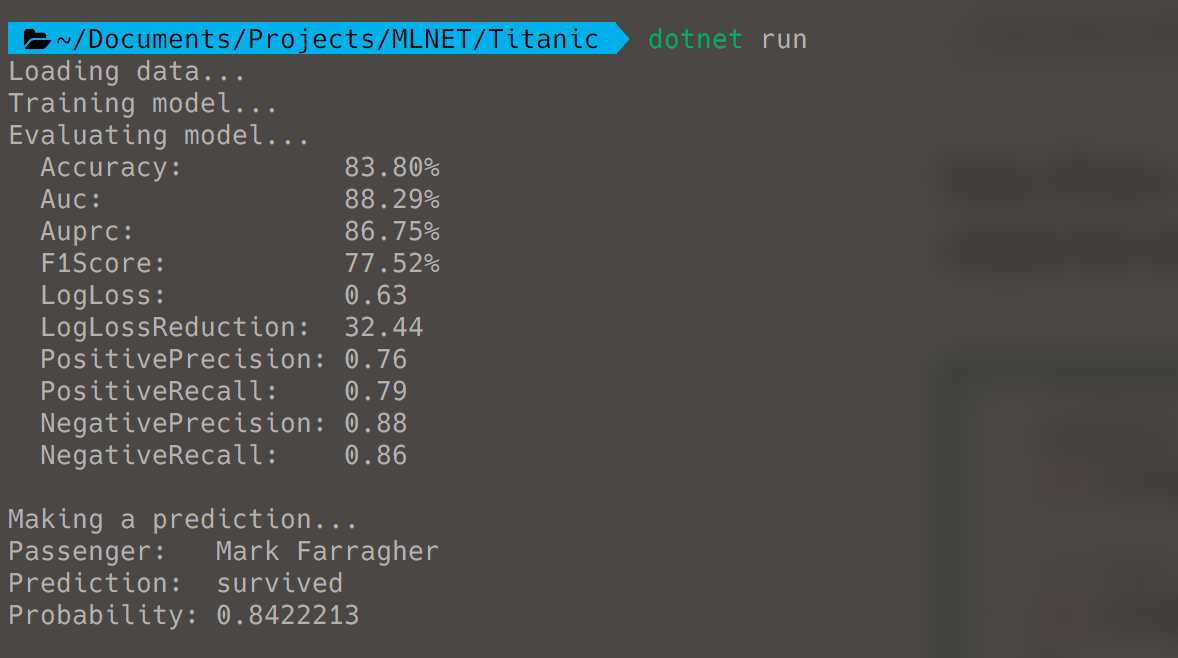
I’m getting an accuracy of 83.8%. It means that for every 100 Titanic passengers, my model is able to predict 83 of them correctly. That’s not bad at all.
I also get an AUC value of 0.8829. This is great, it means my model has good (almost excellent) predictive ability.
And I’m happy to learn that I survived the Titanic disaster. My model predicts that I had a 84.22% chance of making it off the ship alive. It’s probably because I booked a first-class cabin and travelled alone.
Machine Learning With C# And MLNET
This code is part of my online training course Machine Learning with C# and MLNET that teaches developers how to build machine learning applications in C# with Microsoft's MLNET library.
I made this training course after finishing a Machine Learning training course by Google. I really struggled with the complicated technical explanations from the trainer, and I wondered if I could do a better job explaining Machine Learning to my students.
Then Microsoft launched their ML.NET Machine Learning library, and conditions were suddenly ideal for me to start developing my own C# Machine Learning training. And the rest is history.
Anyway, check out the training if you like. It will teach you the ins and outs of the MLNET library and you'll learn the basics of regression, classification, clustering, gradient descent, logistic regression, decision trees, and much more.
Featured Blog Posts
Check out these other blog posts that cover topics from my training courses.
Featured Training Courses
Would you like to learn more? Then please take a look at my featured training courses.
I'm sure I have something that you'll like.
MDFT Academy
- Community
Become a member and get access to every online training course on this site.
Would You Like To Know More?
Sign up for the newsletter and get notified when I publish new posts and articles online.
Let's stay in touch!